SeaHawk begins routine operations

It is our great pleasure to announce that after 2 ½ years of intensive and at times, quite challenging commissioning efforts, our little SeaHawk Cubesat with the HawkEye ocean color instrument onboard entered its routine operations phase on Monday, 21 June 2021.  As with all things that are being attempted for the first time, there were many unforeseen hurdles to overcome and problems to solve but to quote William Shakespeare from Henry VIII – “To climb steep hills requires slow pace at first”.  

Well, we have climbed a very steep hill but the view from the top is magnificent as you can see by taking a look at just a few example images that have been acquired by HawkEye. Full details including links about the mission, its history, data products, operations and data access can be found at: https://oceancolor.gsfc.nasa.gov/data/hawkeye/

Over the course of the commissioning phase of the mission (3 December 2018 – 21 June 2021), a number of different instrument configurations were tested to try and maximize the scientific quality of the images finally settling on a configuration on 16 April 2021 that was decided would be the default as we moved into nominal operations. The current calibration configuration that is used in our production system and that is provided in new version of SeaDAS that will fully support HawkEye data and is being released today, is optimized for data collected after that date.

With the transition to operations, all HawkEye data starting with the very first image taken on March 21st, 2019 through today are now available for browse, download and ordering on the OceanColor Web Browser.

It is anticipated that within the next few weeks, we will start providing the opportunity to the international research community with the ability to schedule the HawkEye instrument to acquire images anywhere in the world and will be sending out all the details on how to do that soon.

Source: Gene Carl Feldman, NASA/Goddard Space Flight Center

FIRST CONTACT ESTABLISHED WITH SEAHAWK

This morning at 12:12 UTC, the clyde space ground station in glasgow, scotland was able to establish contact with seahawk.  as part of that contact, they downlinked the log file and commanded the onboard beacon to send out a signal – all with complete success. in analyzing the data, they reported that the separation/activation sequence that took place 45 minutes after seahawk was deployed from the lower free flyer performed perfectly with all antennas and both solar panels being deployed successfully.  the remaining two panels, one of which serves as the lens cover for the hawkeye instrument will remain closed until we believe that sufficient time has passed for the post-launch out-gassing to have completed and then they will be commanded to deploy.  in addition, the battery voltage is as expected and the logs show that the spacecraft has been “alive” for 15 hours.  


attached is a screenshot showing the location of the seahawk when this first contact was made as well as an actual recording of seahawk’s beacon that was captured by a radio amateur in the u.k. 

for those of you who may have missed the absolutely beautiful launch and spectacular landing, or if you would just like to relive the experience, you can watch a replay of yesterday’s events starting at about 4:50 into the video at:
https://www.youtube.com/watch?v=Wq8kS6UoOrQ&feature=youtu.be&t=289

while we were waiting and hoping for that first contact, i was reminded of the tension that the folks in nasa’s mission control center must have felt back in july of 1969 while waiting to hear if armstrong and aldrin had successfully landed on the moon.  

Neil Armstrong: Houston. Tranquility Base here. The Eagle has landed. 

CAPCOM: Roger Tranquility. We copy you on the ground. You got a bunch of guys about to turn blue. We’re breathing again. Thanks a lot.

while i am not saying that this morning’s event is anywhere close to the historical significance of landing on the moon, but for those us who were waiting for that signal, hearing it certainly allowed our hearts to beat and our lungs to breathe once again.

now on to the next step which involves a careful checkout of the spacecraft and activation of all the key systems that will be needed before we can start to do what seahawk was designed to do – to further our understanding of this incredible planet that we call home.

with my very best regards,

gene

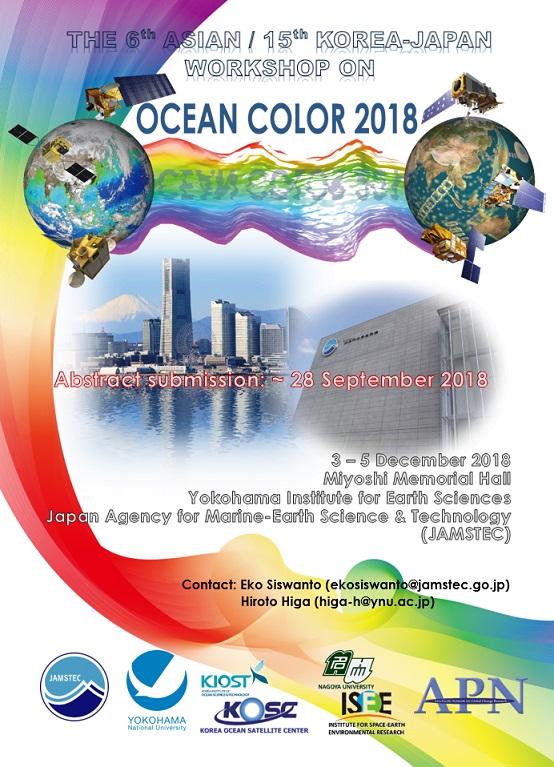
KJWOC 2018 Yokohama

It is with great pleasure to announce that the 6th Asian Workshop on Ocean Color, or the 15th series of Korea-Japan Workshop on Ocean Color (KJWOC) 2018 will be held in Yokohama as detailed below:

Dates: 3 – 5 December 2018
Place:  Miyoshi Hall, Yokohama Institute for Earth Sciences (YES),
           Japan Agency for Marine-Earth Science and Technology (JAMSTEC)

In order to give us an estimation of participant number, we would very much appreciate if you could submit a registration form (attached) before 31 August 2018.

And for abstract (template attached), please submit it before 29 September 2018.
Please submit both registration form and abstract to Dr. Hiroto Higa (higa-h@ynu.ac.jp)and CC Eko Siswanto (ekosiswanto@jamstec.go.jp).

PACE mission observatory update

Greetings from the NASA Plankton, Aerosol, Cloud, ocean Ecosystem (PACE) Project at Goddard Space Flight Center (GSFC). Scheduled for launch in late 2022, PACE is a strategic climate continuity activity that will not only extend key heritage ocean color, cloud, and aerosol data records, but also promises to enable new insight into oceanographic, biological, and atmospheric responses to Earth’s changing climate. We’re writing today to update the community on the mission instruments, all of which recently successfully completed their Preliminary Design Reviews (PDRs).

PACE’s primary instrument is a tilting, global spectrometer being built at GSFC that spans the ultraviolet to near-infrared region at 5 nm resolution and also includes seven discrete shortwave infrared bands centered on 940, 1038, 1250, 1378, 1615, 2130, and 2260 nm.  This ocean color instrument (OCI) will provide 2-day global coverage with a local Equatorial crossing time of 13:00 and nadir footprint of 1-km.  PACE’s OCI passed its PDR in March 2018 and is now beginning engineering test unit development.  Additional details can be found here: https://pace.oceansciences.org/oci.htm .

The PACE payload will also include two small multi-angle polarimeters that measure intensities of polarized light at several viewing angles.  The first, the Spectro-Polarimeter for Planetary Exploration (SPEXone), will be contributed by the Netherlands Institute for Space Research (SRON). SPEXone will provide narrow swath (100 km), hyperspectral data at 2-nm resolution from 385 to 770 nm with 22 polarized bands at 5 view angles and a nadir footprint of ~2.5 km.  SPEXone passed its PDR in June 2018.  The second, the Hyper Angular Rainbow Polarimeter (HARP-2) will be contributed by the University of Maryland Baltimore County.  HARP-2 will provide wide swath (1550 km) polarized and unpolarized data at 440, 550, 670, and 870 nm at 20 to 60 view angles, with a nadir footprint of ~3 km.  HARP-2 passed its PDR earlier this month.  Additional details can be found here: https://pace.oceansciences.org/mission.htm .

Please join me in congratulating the three instrument teams for surpassing their PDR milestones.  We expect that this trio of complementary technologies will enable improved understanding of aquatic ecosystems and biogeochemistry, provide new information on phytoplankton community composition and improved detection of algal blooms, advance aerosol, hydrosol, and cloud characterizations, and provide opportunities for novel ocean color atmospheric correction.

If you’d like to learn more about the PACE mission and its payload, please visit: https://pace.gsfc.nasa.gov , follow @NASAOcean on Twitter, and @NASA.Ocean on Facebook.

Warm regards,

Jeremy, on behalf of the PACE Project

Cornell Summer Satellite Remote Sensing Training Program

Cornell Summer Satellite Remote Sensing Training Program
June 4-15, 2018, Cornell University, Ithaca New York

A two-week summer satellite remote sensing training program is being offered once again to marine scientists who have modest or no prior experience with satellite remote sensing techniques. The training program is highly methods-oriented and intended to give participants the practical skills needed to work independently to acquire, analyze and visualize large data sets derived from a wide range of ocean satellite sensors.

Strong emphasis is given to ocean color remote sensing and the use of NASA’s SeaDAS software to derive mapped imagery of geophysical parameters (e.g., chlorophyll or CDOM) from raw SeaWiFS, MODIS, MERIS, VIIRS and OLCI (Sentinal-3) data sets.  Pre-written python scripts will be used in conjunction with SeaDAS to batch process large quantities of ocean color data from Level-1 to Level-3.

Developing good Python programming skills needed for data analysis and visualization is a central component of this course.  The course also addresses the acquisition and use of Level-3 satellite data products for sea surface temperature, ocean wind speed and sea surface height.

NOTE:  The Ocean Carbon and Biogeochemistry Program (OCB) at the Woods Hole Oceanographic Institution has offered to provided financial support for up to five highly qualified participants to this training program. Applying for OCB support is done independent of the satellite program enrollment process. See the OCB link below for details.


For more information about the training program content and enrollment process:

Visit:    www.geo.cornell.edu/ocean/satellite

Email:   Bruce Monger (bcm3@cornell.edu)

For information about OCB financial support:

Visit: 

Email: Heather Benway (hbenway@whoi.edu)

NASA: Reconstructing the Recent History of Pacific Ocean Life

November 17, 2017

Through several decades of observations, oceanographers have found that the tropical Pacific accounts for about 20 percent of all primary ocean productivity. They also have found that the physics of that ocean basin—the way temperatures, winds, and currents stir up the water—strongly influences the biology moreso than in other parts of the global ocean.

But does the biology of the tropical Pacific change over time and, if so, how does it change? Satellite-based studies of ocean color over the past two decades have revealed some regional, seasonal, and annual patterns. But the large-scale patterns across multiple years and decades are much harder to decipher because of the short record of observations.

New research led by Stephanie Schollaert Uz (NASA’s Goddard Space Flight Center) and colleagues could help ocean scientists better understand how patterns can change over time and how they might respond to a changing climate. The research team has built a statistical reconstruction of Pacific chlorophyll measurements dating back to 1958. It is the first basin-wide, monthly view of chlorophyll changes in the era of modern oceanographic measurements.

Chlorophyll has been measured consistently by satellites for the past 20 years. (There were some early, limited measurements in the late 1970s and 80s.) Chlorophyll is a proxy measurement for phytoplankton—floating, microscopic plant-like organisms that form the center of the marine food web; that is, they are the primary producers on which other organisms feed.

Like plants on land, phytoplankton use chlorophyll to harness sunlight for energy, so the abundance of chlorophyll tells us the abundance of phytoplankton. Furthermore, the location of phytoplankton usually tells us where we can find zooplankton, fish, and higher marine animals that consume them. This primary productivity also plays a key role in producing oxygen and absorbing carbon dioxide from the atmosphere.

The maps above show chlorophyll anomalies in the equatorial Pacific Ocean; that is, how much the concentration of chlorophyll (and therefore phytoplankton) was above or below the long-term norm for the region. (Shades of blue represent less chlorophyll, while stronger greens show areas with more.) The maps are based on the reconstruction developed by Schollaert Uz and colleagues. They highlight a strong La Niña event in 1973, a very strong, basin-wide El Niño in 1982, and a strong Central Pacific El Niño in 1987.

In the tropical Pacific Ocean, sunlight is abundant year round, unlike other regions where changing seasons mean more or less light for phytoplankton. With consistent sunlight, the limiting variable for tropical phytoplankton is the amount of nutrients available near the surface—which is driven by how water is moved by currents and winds.

The “normal” state of the tropical Pacific Ocean has a warm, fresh pool of biologically unproductive water on the surface of the Western Pacific, while cooler, nutrient-rich water wells up in the Eastern Pacific. El Niño and La Niña events shift that balance. La Niña conditions spread the cooler, nutrient-rich waters farther westward across the Pacific, promoting phytoplankton growth across a wider area. El Niño brings much warmer water toward the Central and Eastern Pacific, shutting down the nutrient supply and much of the phytoplankton growth. Eastern Niños tend to suppress growth across the entire basin, while the effects of Central Niños are much more localized.

Schollaert Uz and colleagues constructed their statistical model by taking more than 11 years of real-world measurements from the SeaWiFS instrument and correlating them to other data and models of ocean conditions. They then compiled known measurements of sea surface temperatures and heights in the tropical Pacific dating back to 1958 and reconstructed what chlorophyll concentrations should have looked like every month for fifty years.

“Direct observations are best, but basin-wide observations of sea-surface chlorophyll do not exist before consistent ocean color measurements began in 1997,” said Schollaert Uz. “We took advantage of the fact that Earth is a coupled system, in which tropical Pacific Ocean biology is largely controlled by physics, and used the longer physical records to reconstruct a large-scale view of chlorophyll.”

The reconstruction will allow researchers to examine and extrapolate conditions during El Niño and La Niña events that were not captured by satellite. Several studies have shown, for instance, that winds and ocean upwelling might have been more or less intense in the 1950s through the 1970s, but there is no corresponding ocean color data to demonstrate how that affected biology. The new statistical model offers a look into the recent past that could ultimately help us better see the future.

Source

NASA: Ocean Green, Blooming Ocean

EO Kids

These tiny organisms do big things for our #LivingPlanet. Learn more about our Ocean Green with #EOkidshttps://earthobservatory.nasa.gov/eokids

EO Kids, a publication from the Earth Observatory, highlights science stories for a younger audience. In our new edition, we explore the swirling seas of phytoplankton blooms and invite kids to create their own NASA science visualization by making a flipbook. Read about how these tiny organisms are making a big impact on our living Earth. Flip through the pages and see the ocean change color as phytoplankton blooms and the land changes between brown and green as the seasons change. Watch as the Earth comes alive with the flip of a page.

Download the PDF at the following link

https://earthobservatory.nasa.gov/eokids/pdf/EOKids_BloomingOceans508.pdf

NASA: Our Living Planet From Space

13 Nov 2017

Life. It’s the one thing that, so far, makes Earth unique among the thousands of other planets we’ve discovered. Since the fall of 1997, NASA satellites have continuously and globally observed all plant life at the surface of the land and ocean. Earth is still the only planet we know of with life – with that in mind, our habitable home world seems evermore fragile and beautiful when considering the vastness of unlivable space.

Read more at NASA GMS

Spatial distribution of phytoplankton along the Sunda Islands: The monsoon anomaly in 1998

Asanuma, I., K. Matsumoto, H. Okano, T. Kawano, N. Hendiatri, and S.I. Sachoemar (2003): Spatial distribution of phytoplankton along the Sunda Islands: The monsoon anomaly in 1998. J. Geophys. Res., 108 (C6), 3202, doi:10.1029/1999JC000139.

Abstract

Recent ocean color and microwave observations are used to assess the spatial distribution of phytoplankton blooming relative to monsoons along the Sunda Islands. In 1997 and 1999, during the northwest monsoon the eastward South Java Current (SJC) along the Sunda Islands restrained the flows from the straits along the Sunda Islands and ceased blooming. During the southeast monsoon the westward South Equatorial Current (SEC) and the southeasterly wind generated cyclonic eddies along the Sunda Islands. The blooming was observed over those cyclonic eddies, where nutrients were entrained to the surface. In 1998, through the northwest to the southeast monsoon the eastward currents were flowing away from the coast. During the southeast monsoon the SEC was not observed. Through 1998, cyclonic eddies were observed along the Sunda Islands in consequence of these anomalies. The distribution of currents is defined for the monsoon anomaly in 1998. (1) The eastward SJC flowed away from the coast in the northwest monsoon. (2) No westward SEC was observed in the southeast monsoon. (3) The eastward SJC restrained the flow from the straits in the southeast monsoon. (4) Chlorophyll a ∼1 mg m−3 were observed along the Sunda Islands through the year. This monsoon anomaly is hypothesized as a result of anomalies in the distribution of pressure systems between the Pacific and the Indian Ocean following to the El Niño.

Keywords:

  • phytoplankton;
  • chlorophyll;
  • ocean color;
  • remote sensing;
  • Indonesia;
  • through flow